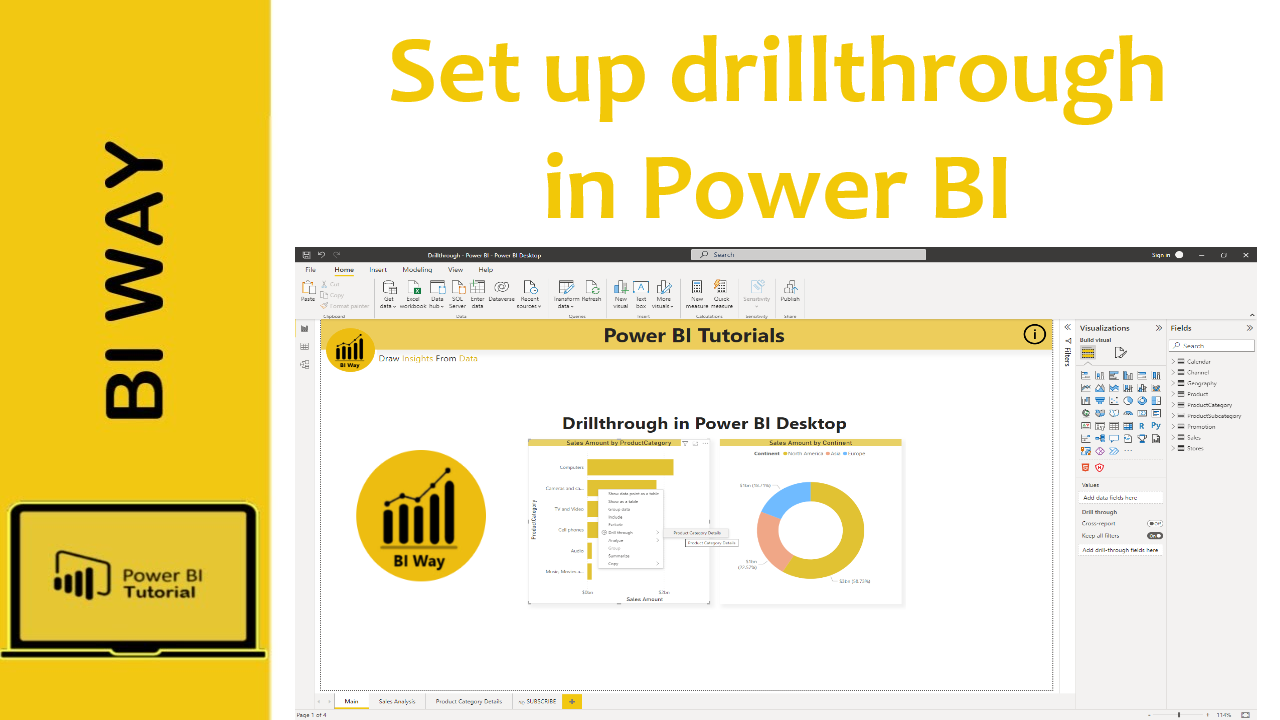
In the first blog post about using HTML in Power BI Desktop, we saw how to create beautiful cards and display data using the HTML Content Visual. In this second blog post I will share the code for more examples, you can watch the video in the Related Video section for more details.
1- Accordion :
Accordions are useful when you want to toggle between hiding and showing large amount of content
Below is the HTML code for this visualization
<!DOCTYPE html>
<html>
<head>
<title>BI Way</title>
<style>
.accordion {
box-sizing: border-box;
display: flex;
font-family: Arial, Helvetica, sans-serif;
overflow: hidden;
width: 100%;
}
.accordion-select {
cursor: pointer;
margin: 0;
opacity: 0;
z-index: 1;
}
.accordion-title {
position: relative;
}
.accordion-title:not(:nth-last-child(2))::after {
border: 1px solid transparent;
bottom: 0;
content: '';
left: 0;
position: absolute;
right: 0;
top: 0;
}
.accordion-title span {
bottom: 0px;
box-sizing: border-box;
display: block;
position: absolute;
white-space: nowrap;
width: 100%;
}
.accordion-content {
box-sizing: border-box;
overflow: auto;
position: relative;
transition: margin 0.3s ease 0.1s;
}
.accordion-select:checked + .accordion-title + .accordion-content {
margin-bottom: 0;
margin-right: 0;
}
.accordion {
border-color: #dedede;
border-radius: 8px;
border-style: solid;
border-width: 1px;
flex-direction: column;
height: auto;
}
.accordion-title,
.accordion-select {
background-color: #ffffff;
color: #7f8787;
width: 100%;
height: 45px;
font-size: 15px;
}
.accordion-select {
margin-bottom: -45px;
margin-right: -45px;
}
.accordion-title:not(:nth-last-child(2))::after {
border-bottom-color: rgb(234, 234, 234);
border-right-color: transparent;
}
.accordion-select:hover + .accordion-title,
.accordion-select:checked + .accordion-title {
background-color: #ffffff;
}
.accordion-title span {
transform: rotate(0deg);
-ms-writing-mode: lr-tb;
filter: progid:DXImageTransform.Microsoft.BasicImage(rotation=0);
padding-left: 13px;
padding-right: 13px;
line-height: 45px;
}
.accordion-content {
background-color: #f7f7f7;
color: #7f8787;
height: 160px;
margin-bottom: -160px;
margin-right: 0;
padding: 20px;
width: 100%;
}
</style>
</head>
<body>
<div class="accordion">
<input type="radio" name="select" class="accordion-select" checked />
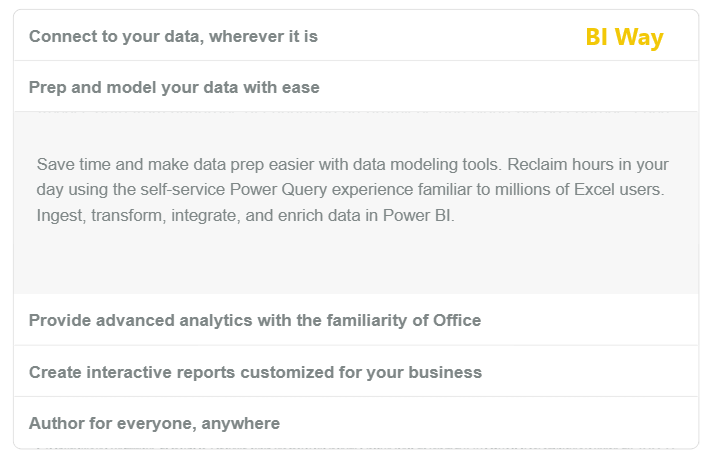
<div class="accordion-title"><span><strong>Connect to your data, wherever it is</strong></span></div>
<div class="accordion-content"><p>Access data from hundreds of supported on-premises and cloud-based sources, such as Dynamics 365, Salesforce, Azure SQL DB, Excel, and SharePoint. Ensure it’s always up to date with automated, incremental refreshes. Power BI Desktop enables you to develop deep, actionable insights for a broad range of scenarios.</p></div>
<input type="radio" name="select" class="accordion-select" />
<div class="accordion-title"><span><strong>Prep and model your data with ease</strong></span></div>
<div class="accordion-content"><p>Save time and make data prep easier with data modeling tools. Reclaim hours in your day using the self-service Power Query experience familiar to millions of Excel users. Ingest, transform, integrate, and enrich data in Power BI.</p></div>
<input type="radio" name="select" class="accordion-select" />
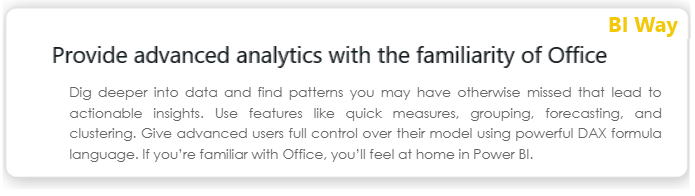
<div class="accordion-title"><span><strong>Provide advanced analytics with the familiarity of Office</strong></span></div>
<div class="accordion-content"><p>Dig deeper into data and find patterns you may have otherwise missed that lead to actionable insights. Use features like quick measures, grouping, forecasting, and clustering. Give advanced users full control over their model using powerful DAX formula language. If you’re familiar with Office, you’ll feel at home in Power BI.</p></div>
<input type="radio" name="select" class="accordion-select" />
<div class="accordion-title"><span><strong>Create interactive reports customized for your business</strong></span></div>
<div class="accordion-content"><p>Create stunning reports with interactive data visualizations. Tell your data story using a drag-and-drop canvas and hundreds of modern data visuals from Microsoft and partners—or create your own, using the Power BI open source custom visuals framework. Design your report with theming, formatting, and layout tools.</p></div>
<input type="radio" name="select" class="accordion-select" />
<div class="accordion-title"><span><strong>Author for everyone, anywhere</strong></span></div>
<div class="accordion-content"><p>Get visual analytics to the people who need it. Create mobile-optimized reports for viewers to consume on the go. Publish from Power BI Desktop to the cloud or on-premises. Embed reports created in Power BI Desktop into existing apps or websites.</p></div>
</div>
</body>
</html>
2- Slider content - 1 :
Another way to save space in a power bi report page is to use a Slider that allows to automatically switch between contents
Below is the HTML code for this visualization
<!DOCTYPE html>
<html>
<head>
<title>BI Way</title>
<style>

a
{
	text-decoration: none;
	color: #111b47;
}

a:hover
{
	border-bottom: 1px dashed #ED971F;
	color: #ED971F;
}

#slider, ul
{
	height: 150px;
}

#slider
{
	margin: auto;
	overflow: hidden;
	padding: 15px;
	border: 1px solid rgba(0, 0, 0, 0.15);
	margin-top: 10px;
	border-radius: 10px;
	box-shadow: 2px 2px 14px rgba(0, 0, 0, 0.25);
	position: relative;
	width: 600px;
}

#slider li
{
	float: left;
	position: relative;
	width: 600px;
	display: inline-block;
	height: 150px;
}

#slider ul
{
	list-style: none;
	position: absolute;
	left: 0px;
	top: 0px;
	width: 9000px;
	transition: left .3s linear;
	-moz-transition: left .3s linear;
	-o-transition: left .3s linear;
	-webkit-transition: left .3s linear;
	margin-left: -25px;
  font-family: century gothic;
  color: #666;
}

/*** Content ***/

.slider-container
{
	margin: 0 auto;
	padding: 0;
	width: 550px;
  min-height: 180px;
  border-bottom: 1px solid #ccc;
}

.slider-container h4
{
 	color: #121c20;
  text-shadow: -1px 0px 0px rgba(0, 0, 0, 0.50);
}

.slider-container  p
{
	margin: 5px 15px;
	font-weight: semi-bold;
	line-height: 150%;
	text-align: justify;
}

@-webkit-keyframes slide-animation {
	0% {opacity:0;}
	2% {opacity:1;}
	20% {left:0px; opacity:1;}
	22.5% {opacity:0.6;}
	25% {left:-600px; opacity:1;}
	45% {left:-600px; opacity:1;}
	47.5% {opacity:0.6;}
	50% {left:-1200px; opacity:1;}
	70% {left:-1200px; opacity:1;}
	72.5% {opacity:0.6;}
	75% {left:-1800px; opacity:1;}
	95% {opacity:1;}
	98% {left:-1800px; opacity:0;}
	100% {left:0px; opacity:0;}
}

#slider ul
{
	-webkit-animation: slide-animation 25s infinite;
}

/* use to paused the content on mouse over */

#slider ul:hover
{
	-moz-animation-play-state: paused;
	-webkit-animation-play-state: paused;
}

.new-version {
 position: absolute;
 bottom: 10px;
 border: 1px solid #ccc;
 padding: 10px 15px;
 background-color: #7effca;
}

</style>
</head>
<body>

<div id="slider">
<ul>
	<li>
	<div class="slider-container">
    <h4>Connect to your data, wherever it is</h4>
		<p>Access data from hundreds of supported on-premises and cloud-based sources, such as Dynamics 365, Salesforce, Azure SQL DB, Excel, and SharePoint. Ensure it’s always up to date with automated, incremental refreshes. Power BI Desktop enables you to develop deep, actionable insights for a broad range of scenarios.</p>
	</div>
	</li>
		<li>
		<div class="slider-container">
       <h4>Prep and model your data with ease</h4>
		<p>Save time and make data prep easier with data modeling tools. Reclaim hours in your day using the self-service Power Query experience familiar to millions of Excel users. Ingest, transform, integrate, and enrich data in Power BI.</p>
	</div>
	</li>
		<li>
		<div class="slider-container">
       <h4>Provide advanced analytics with the familiarity of Office</h4>
		<p>Dig deeper into data and find patterns you may have otherwise missed that lead to actionable insights. Use features like quick measures, grouping, forecasting, and clustering. Give advanced users full control over their model using powerful DAX formula language. If you’re familiar with Office, you’ll feel at home in Power BI.</p>
	</div>
	</li>
		<li>
		<div class="slider-container">
      <h4>Create interactive reports customized for your business</h4>
		<p>Create stunning reports with interactive data visualizations. Tell your data story using a drag-and-drop canvas and hundreds of modern data visuals from Microsoft and partners—or create your own, using the Power BI open source custom visuals framework. Design your report with theming, formatting, and layout tools.</p>
	</div>
	</li>
		<li>
		<div class="slider-container">
      <h4>Author for everyone, anywhere</h4>
		<p>Get visual analytics to the people who need it. Create mobile-optimized reports for viewers to consume on the go. Publish from Power BI Desktop to the cloud or on-premises. Embed reports created in Power BI Desktop into existing apps or websites.</p>
	</div>
	</li>
</ul>
</div>
</body>
</html>
3- Slider content - 2 :
This is another example of the Slider content which allows to switch between contents manually
Below is the HTML code for this visualization
<!DOCTYPE html>
<html>
<head>
<title>BI Way</title>
<style>
* {
box-sizing: border-box;
}
body {
font-family: sans-serif;
overflow: hidden;
}
label {
background: #444;
color: #fff;
transition: transform 400ms ease-out;
display: inline-block;
min-height: 100%;
width: 100vw;
height: 100vh;
position: relative;
z-index: 1;
text-align: center;
line-height: 100vh;
}
form {
position: absolute;
top: 0;
left: 0;
bottom: 0;
right: 0;
white-space: nowrap;
}
input {
position: absolute;
}
.keys {
position: fixed;
z-index: 10;
bottom: 0;
left: 0;
right: 0;
padding: 1rem;
color: #fff;
text-align: center;
transition: all 300ms linear;
opacity: 0;
}
input:focus ~ .keys {
opacity: 0.8;
}
input:nth-of-type(1):checked ~ label:nth-of-type(1),
input:nth-of-type(2):checked ~ label:nth-of-type(2),
input:nth-of-type(3):checked ~ label:nth-of-type(3),
input:nth-of-type(4):checked ~ label:nth-of-type(4){
z-index: 0;
}
input:nth-of-type(1):checked ~ label {
transform: translate3d(0, 0, 0);
}
input:nth-of-type(2):checked ~ label {
transform: translate3d(-100%, 0, 0);
}
input:nth-of-type(3):checked ~ label {
transform: translate3d(-200%, 0, 0);
}
input:nth-of-type(4):checked ~ label {
transform: translate3d(-300%, 0, 0);
}
label {
background: #444;
background-size: cover;
font-size: 1.5rem;
}
label[for="quantityY1"],
label[for="salesY1"] {
background: #E8D166;
}
label:before,
label:after {
color: white;
display: block;
background: rgba(255,255,255,0.2);
position: absolute;
padding: 0.8rem;
font-size: 1.8rem;
height: 5rem;
vertical-align: middle;
line-height: 4rem;
top: 50%;
transform: translate3d(0, -50%, 0);
cursor: pointer;
}
label:before {
content: "\276D";
right: 100%;
border-top-left-radius: 50%;
border-bottom-left-radius: 50%;
}
label:after {
content: "\276C";
left: 100%;
border-top-right-radius: 50%;
border-bottom-right-radius: 50%;
}
</style>
</head>
<body>
<form>
<input type="radio" name="fancy" autofocus value="sales" id="sales" />
<input type="radio" name="fancy" value="salesY1" id="salesY1" />
<input type="radio" name="fancy" value="quantity" id="quantity" />
<input type="radio" name="fancy" value="quantityY1" id="quantityY1" />
<label for="sales"><strong> Sales Amount : </strong></span> " & FORMAT( Sales[SumSalesAmount], "Currency") & "</label>
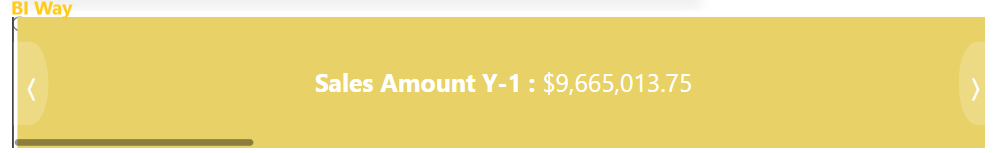
<label for="salesY1"><strong> Sales Amount Y-1 : </strong></span> " & FORMAT( Sales[SalesAmountY-1], "Currency") & "</label>
<label for="quantity"><strong> Sales Quantity : </strong></span> " & FORMAT( Sales[SumSalesQuantity], "#,#") & "</label>
<label for="quantityY1"><strong> Sales Quantity Y-1 : </strong></span> " & FORMAT( Sales[SalesQuantityY-1], "#,#") & "</label>
<div class="keys">Use left and right keys to navigate</div>
</form>
</body>
</html>
4- Card :
This example uses HTML to create a nice card with a zoom effect when we hover over a value.
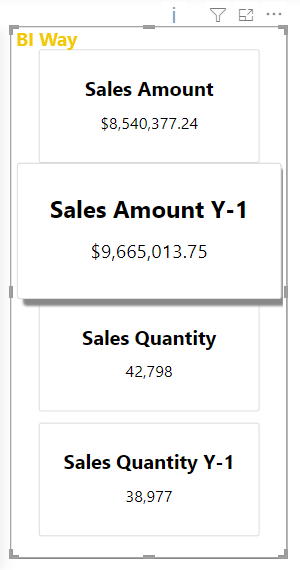
Below is the HTML code for this visualization
<!DOCTYPE html>
<html>
<head>
<link href="//maxcdn.bootstrapcdn.com/bootstrap/4.1.1/css/bootstrap.min.css" rel="stylesheet" id="bootstrap-css">
<link href="//netdna.bootstrapcdn.com/bootstrap/3.1.0/css/bootstrap.min.css" rel="stylesheet" id="bootstrap-css">
<script src="//netdna.bootstrapcdn.com/bootstrap/3.1.0/js/bootstrap.min.js"></script>
<script src="//code.jquery.com/jquery-1.11.1.min.js"></script>
<title>BI Way</title>
<style>
.row {
    margin: 10px 0px 10px 0px;
    }

.card {
    margin: 5px 5px 5px 5px;
    padding: 15px;
    -webkit-transform: scale(1, 1);
    -ms-transform: scale(1, 1);
    transform: scale(1, 1);
    transition-duration: 0.3s;
    -webkit-transition-duration: 0.3s;
    text-align: center;
    width: 200px;
    }

.card:hover {
	cursor: pointer;
	-webkit-transform: scale(2, 2);
    -ms-transform: scale(2, 2);
    transform: scale(1.2, 1.2);
    transition-duration: 0.3s;
    -webkit-transition-duration: 0.3s;
    box-shadow: 5px 5px 2px #888888;
    z-index: 1;
    }
</style>
</head>
<body>

<div class="container">
  <div class="row">
    <div class="card">
        <h4><b>Sales Amount</b></h4>
        <p>" & FORMAT( Sales[SumSalesAmount], "Currency")   & "</p>
    </div>
    <div class="card">
        <h4><b>Sales Amount Y-1</b></h4>
        <p>" & FORMAT( Sales[Sales Amount N-1], "Currency")   & "</p>
    </div>
    <div class="card">
        <h4><b>Sales Quantity</b></h4>
        <p>" & FORMAT( sum(Sales[SalesQuantity]), "#,#")   & "</p>
    </div>
    <div class="card">
        <h4><b>Sales Quantity Y-1</b></h4>
        <p>" & FORMAT( Sales[SalesQuantityY-1], "#,#")   & "</p>
    </div>

  </div>
</div>

</body>
</html>
Related Video: