Tooltips can provide more contextual information and detail to data points on a visual. Since May 2021, Microsoft has released a preview of the modern visual tooltips feature, which allows us to perform the drill actions.
The modern visual tooltips (preview) include data point drill actions.
To create a modern visual tooltip, you need first to enable this preview feature, to do so, follow the steps below:
- Activate the new tooltips for new reports in Options and settings
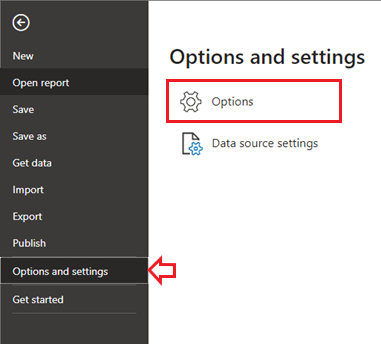
- Go to File in Power BI Desktop, select Options and settings then Options
-
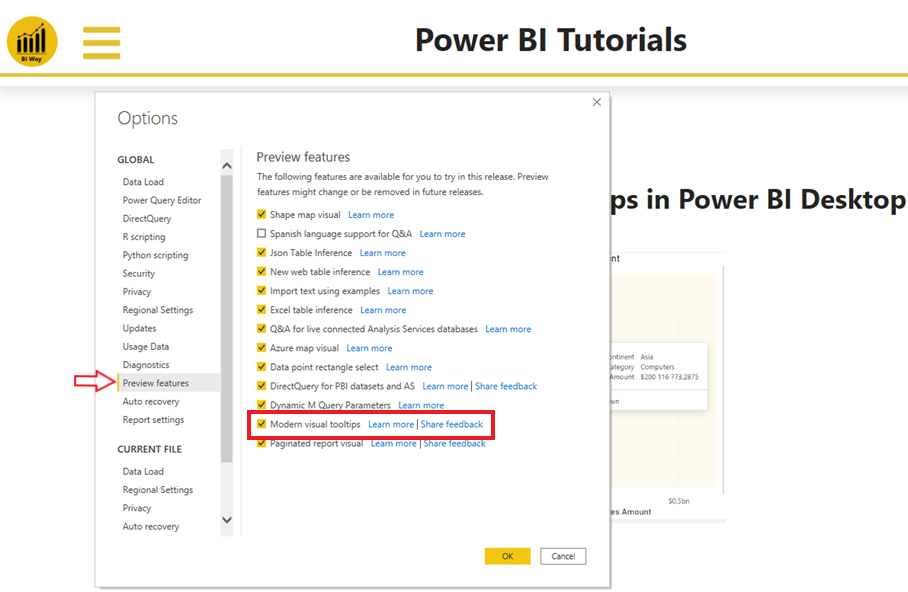
- In Preview features, select the Modern visual tooltips checkbox
-
- Select Ok then restart your Power BI Desktop
- Activate the new tooltips for existing reports
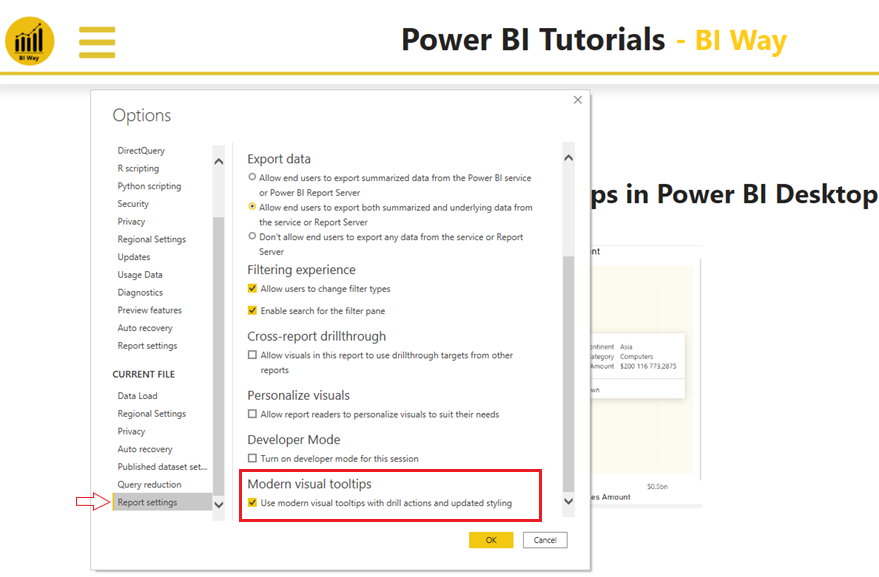
- Go to File in Power BI Desktop, select Options and settings then Current file
- In Report settings, select the checkbox under Modern visual tooltips.
- Select OK
Modern tooltips:
After enabling the new tooltip, it will look like the tooltip in the image below.
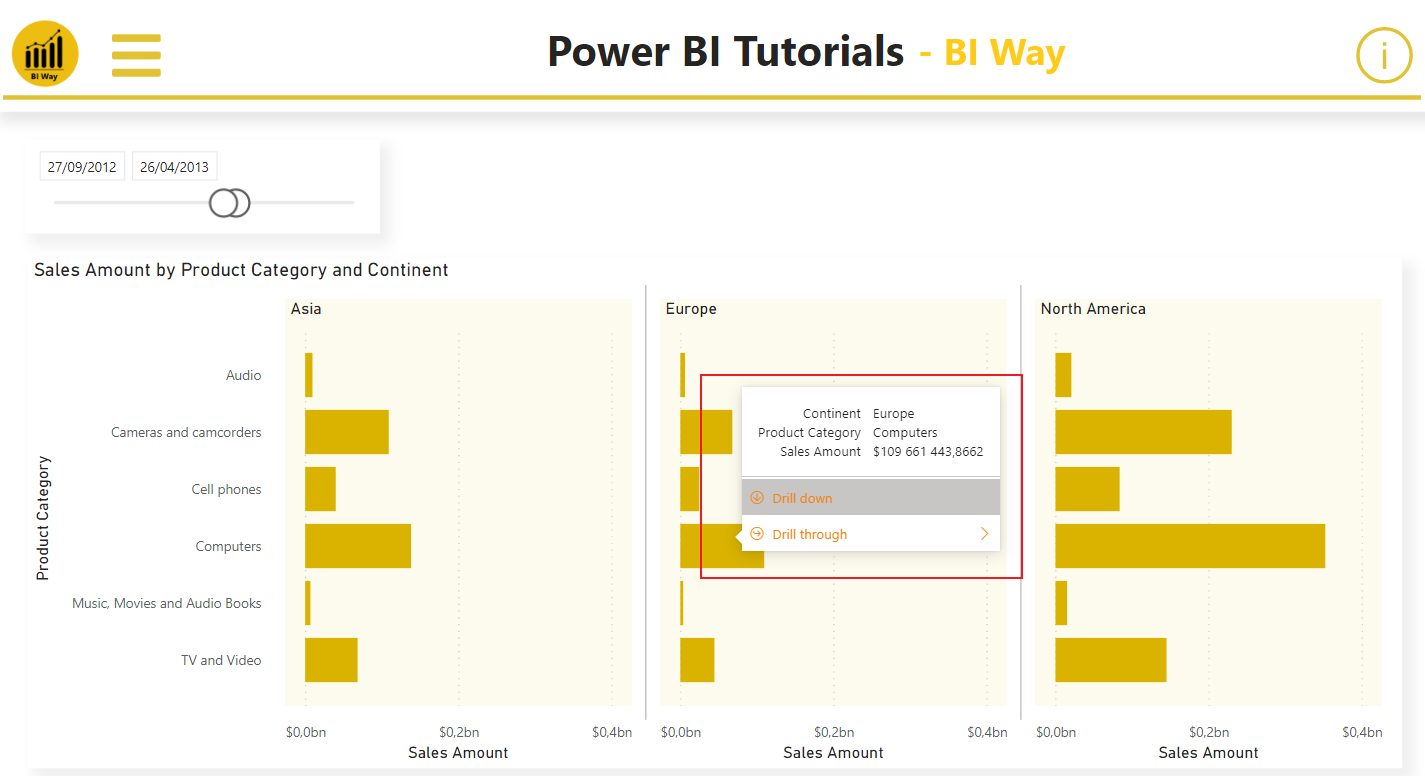
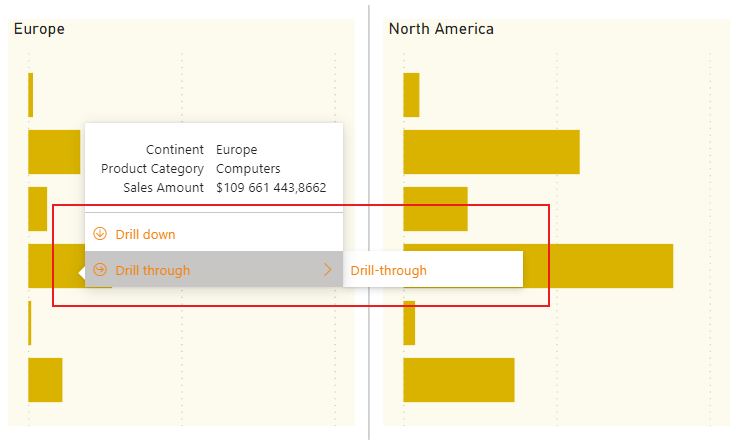
when you hover over a bar chart, it will allow you to drill down and up, and drill through on a data point without having to use the right-click menu or the header for the visual.
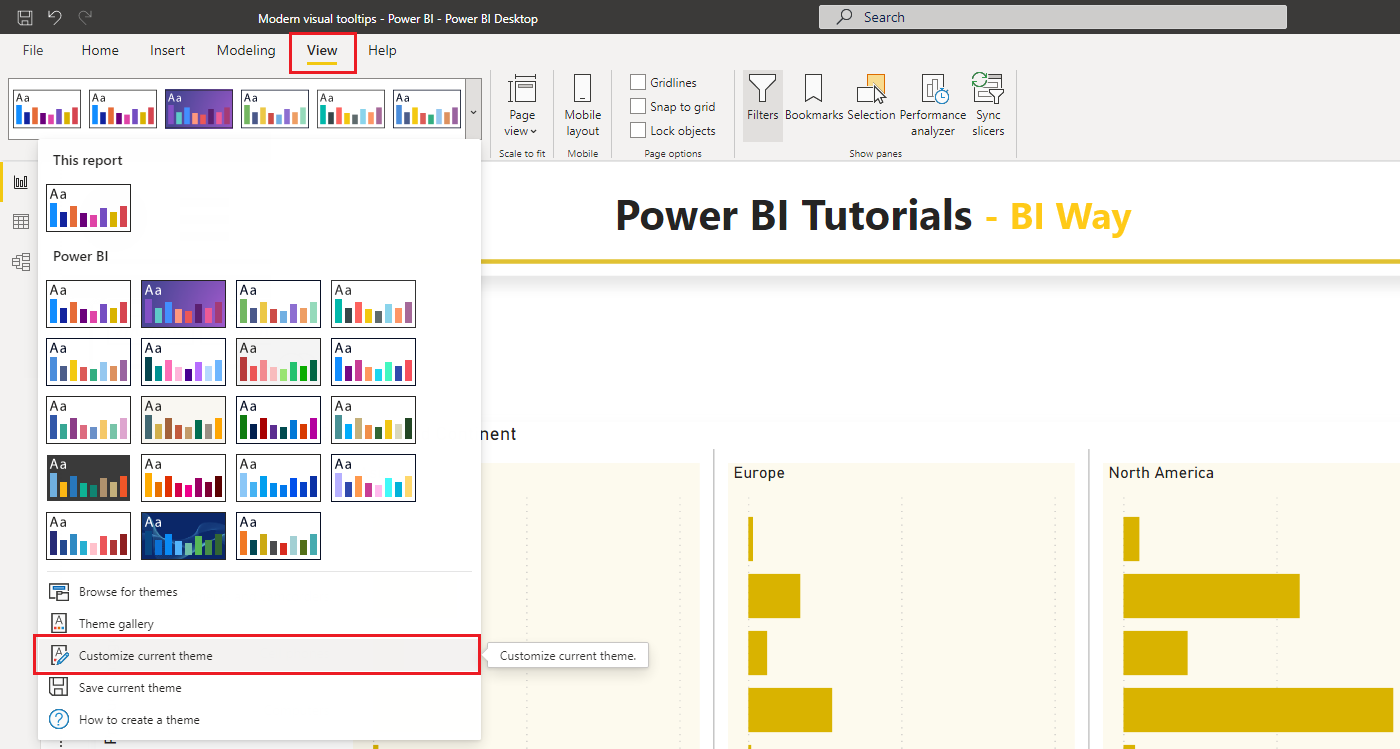
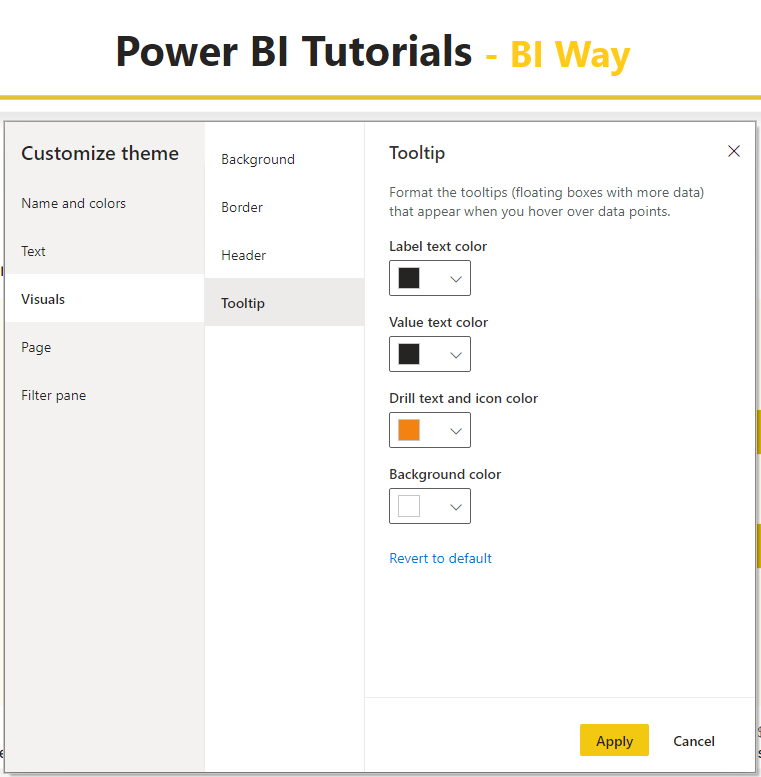
Another interesting thing is that the style of the new tooltip changes depending on the colors of the report theme, and you can customize it in the Customize Theme dialog box.
In the View ribbon, click on Customize current theme, select Visuals then Tooltips and choose your colors
It should be noted, as of the creation date of this article, that drill actions aren't available in the tooltip for report page tooltips and for the following visuals:
- Matrix visuals
- Line charts
- Area charts
- Stacked area charts
- Decomposition trees
- AppSource visuals (custom visuals)
Related Video: