You can split a visual into several versions of itself based on one or more dimensions. To do so, you can use Small Multiples.
Depending on the chosen dimension, small multiples will split a visual into multiple versions of itself, with data divided across each version.
But it should be noted, as of the creation date of this article, that small multiples are currently supported on bar, column, line, area charts and combo chart.
Create small multiples
To create small multiples, you can follow the following steps:
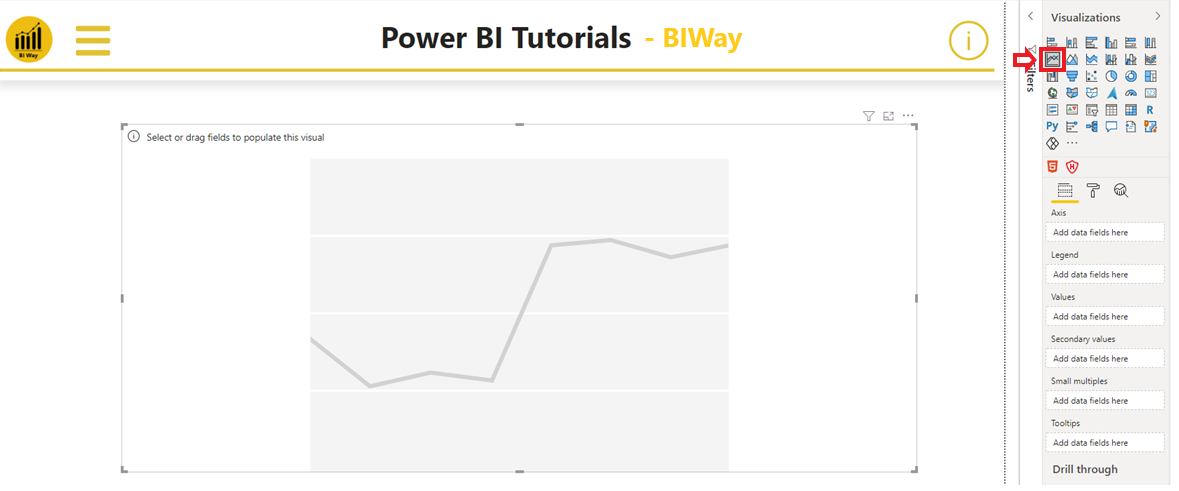
- Add one of the visuals mentioned above, for example a line chart visual
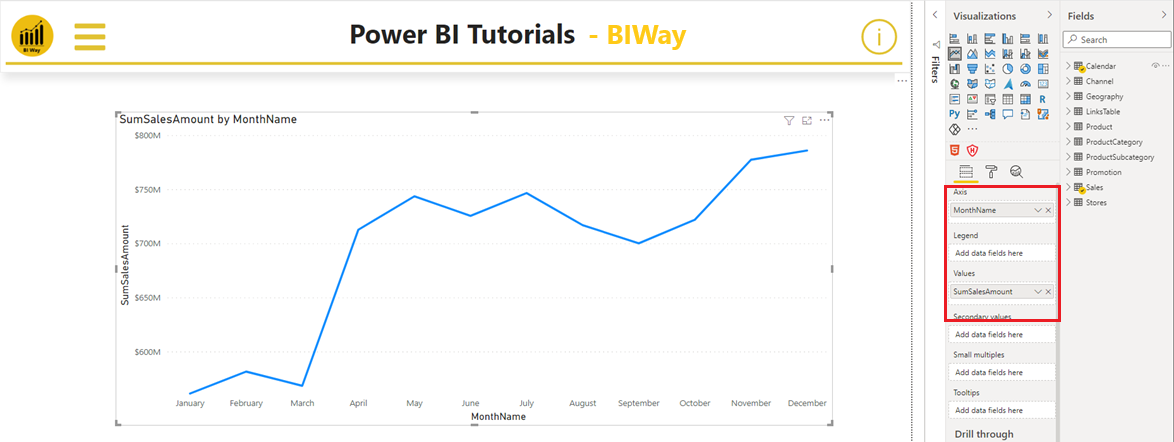
- Add your fields or measures to the visual, sales amount and months.
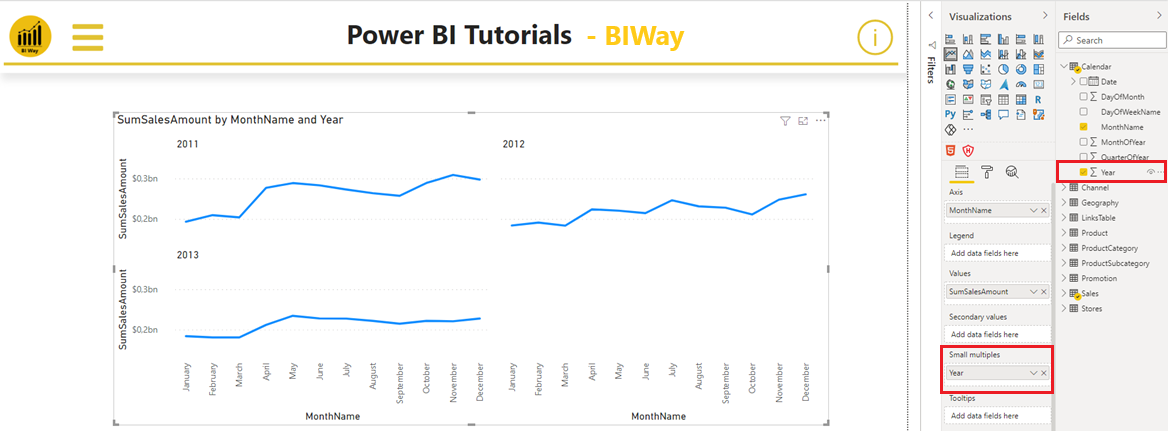
- Drag the year field into the small multiples in the Fields section of the Visualizations pane.
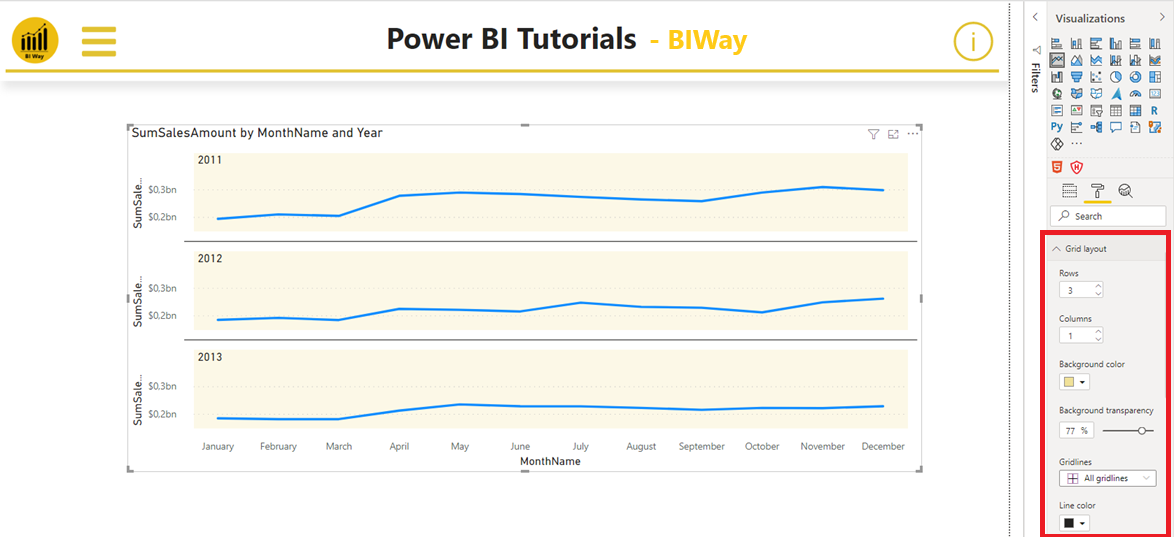
- On the formatting pane, you can change the grid dimensions, the color of background and its transparency by clicking on then select the Grid layout
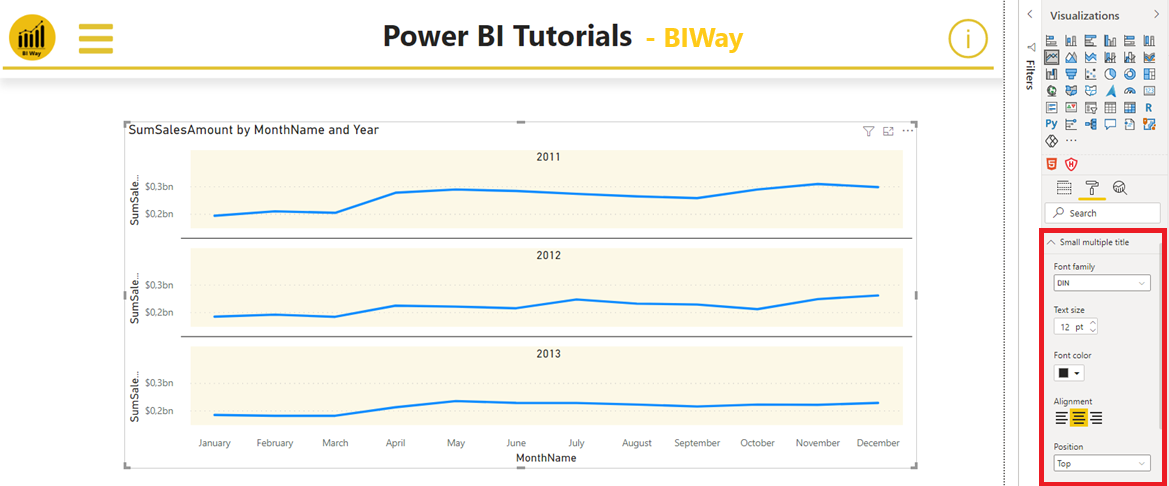
- In the Small multiple title card, you can adjust the style and position of the small multiple titles (font family, color, size…)
Related Video: