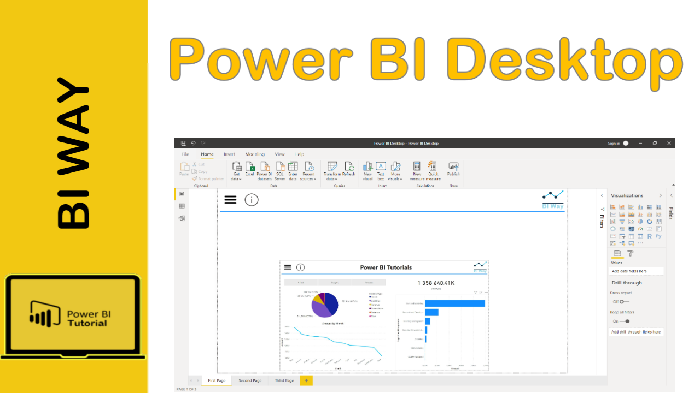
Power BI Desktop
Power BI Desktop is a free application that lets you connect to multiple data sources, create a data model and then build custom reports that you can share with your coworkers and organizations.
Steps to use Power BI Desktop
Generally, to create a report in Power BI, we follow the steps below:
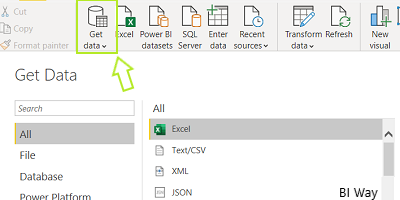
- Connect to data:
The first step to create a report in Power BI Desktop is to connect to data. To do so, you can select Get Data from the Home ribbon then choose your data category (Database, file, Azure…).
Depending on your data source, you’ll be prompted to add additionnal informations such as credentials… so that Power BI Desktop can connect to the source.
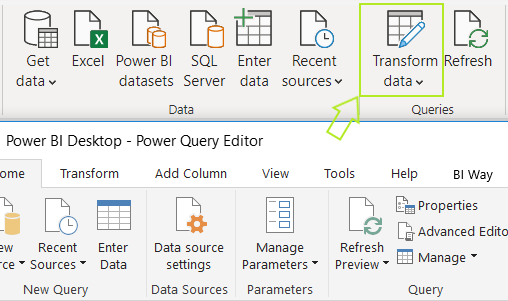
- Transform and clean data:
After connecting to the data sources, you can transform and clean the data using the Power Query Editor, it allows you to reshape your data as needed.
To launch Power Query Editor, select Transform Data from the Home ribbon.
- Create reports:
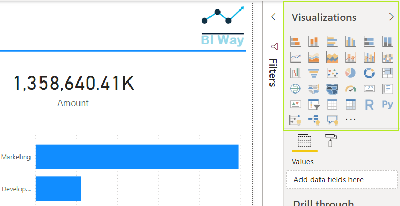
Report in Power BI Desktop is a collection of visuals and it can have one or more pages.
After having a data model, you can drag fields into the report canvas to create visuals that display the data in a visual representation.
You can create complex and visually rich reports, using data from multiple sources, all in one report.
- Share report:
When you finish adding visuals and creating your reports, it's time to share your work with anyone in your organization who has a Power BI license.
To do so, select Publish from the Home ribbon and then the reports will be available in the Power BI service.
![]()
To sum up, Power BI Desktop let’s you:
- Connect to multiple different sources of data
- Transform and clean that data
- Create a data model
- Create visual representations of the data
- Create reports on one or more report pages
- Share reports with others using the Power BI service
Related Video: